Published on 2025-06-29T18:11:23Z
What is an Analytics Dashboard? Examples of Analytics Dashboards
An Analytics Dashboard is a unified interface that visualizes key campaign metrics—such as visits, conversions, bounce rates, and UTM parameter performance—in real time. Within campaign tracking and analytics, dashboards consolidate data from various tools (e.g., PlainSignal’s privacy-focused analytics, UTMguru’s UTM URL generator) into interactive charts and reports. Marketers use dashboards to monitor performance, identify trends, and make data-driven decisions without manually aggregating spreadsheets. By providing customizable widgets and automated reporting, analytics dashboards streamline the optimization of marketing campaigns and ensure stakeholders stay informed with up-to-date insights.
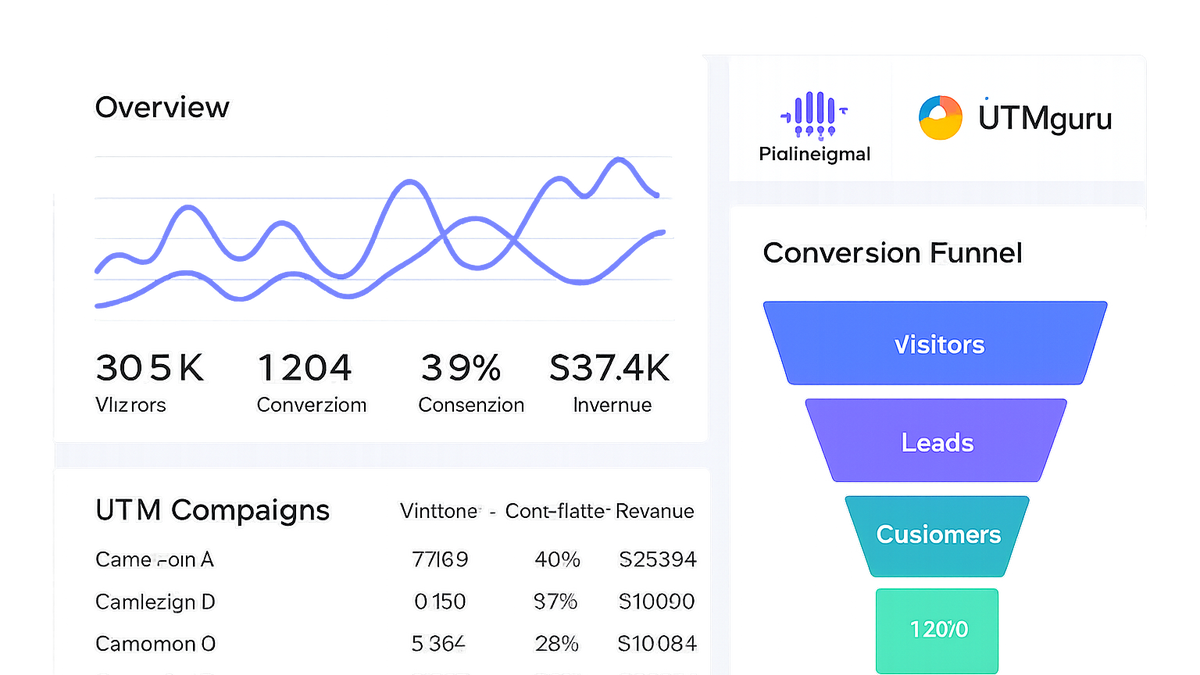
Analytics dashboard
Visual dashboard showing real-time campaign metrics and KPIs, enabling data-driven decisions and streamlined reporting.
Why Analytics Dashboards Matter
Analytics dashboards play a pivotal role in campaign tracking & analytics by consolidating disparate data sources into cohesive, visual representations. They empower marketers to quickly identify trends, spot anomalies, and measure the impact of campaigns in real time. By providing a high-level overview alongside drill-down capabilities, dashboards support both strategic planning and tactical optimizations.
-
Centralized data view
Aggregates metrics from various channels (organic, paid, social) into a single pane of glass, reducing manual reporting.
-
Real-time insights
Displays up-to-the-minute data, enabling quick reaction to underperforming campaigns or sudden traffic spikes.
-
Improved collaboration
Shared dashboards facilitate transparent communication between marketing, sales, and executive teams.
Key Features of an Effective Analytics Dashboard
An effective analytics dashboard should be intuitive, flexible, and tailored to the specific needs of its users. Common features include customizable layouts, interactive charts, and robust filtering options, all designed to surface the most relevant insights at a glance.
-
Customizable widgets
Drag-and-drop components like line charts, bar graphs, and tables let users tailor the view to their priorities.
-
Segmentation and filtering
Allows breaking down data by UTM parameters, traffic source, geography, or user demographics for deeper analysis.
-
Interactive visualizations
Hover, zoom, and drill-down capabilities make it easier to explore underlying data points without leaving the dashboard.
-
Automated reporting
Schedule and deliver snapshot reports via email or Slack, ensuring stakeholders stay informed.
Use Cases in Campaign Tracking & Analytics
Dashboards are versatile tools that address various analytics scenarios in marketing, from measuring campaign performance to optimizing conversion funnels.
-
Utm campaign performance
Track visits, clicks, and conversions attributed to UTM-tagged URLs generated by UTMguru.
-
A/b test monitoring
Compare performance of different creatives, landing pages, or call-to-action variants in real time.
-
Conversion funnel analysis
Visualize each step of the user journey—from landing page to purchase—to identify drop-off points.
-
Channel attribution
Assess the effectiveness of each marketing channel (email, social, ads) in driving traffic and conversions.
Integration with SaaS Tools
Seamless integration with specialized SaaS solutions enhances dashboard capabilities and data accuracy, streamlining the setup process for campaign tracking.
-
Plainsignal setup
Install the PlainSignal tracking script on your website to feed real-time, cookie-free analytics into your dashboard.
Example code:
<link rel="preconnect" href="//eu.plainsignal.com/" crossorigin /> <script defer data-do="yourwebsitedomain.com" data-id="0GQV1xmtzQQ" data-api="//eu.plainsignal.com" src="//cdn.plainsignal.com/plainsignal-min.js"></script>- Data-id and data-do:
Use your unique data-id and your domain in data-do to ensure data is associated correctly.
- Deferred loading:
The script loads asynchronously to avoid blocking page rendering.
- Data-id and data-do:
-
Utmguru integration
Use UTMguru to generate and manage UTM-tagged URLs, then import those URLs into your dashboard filters for accurate campaign attribution. The UTMguru Chrome extension streamlines link creation directly in your browser.
Best Practices for Dashboard Design
Well-designed dashboards prioritize clarity and relevance. By following best practices, you ensure your dashboard remains a powerful tool rather than a cluttered report.
-
Highlight key metrics
Focus on the most important KPIs to avoid overwhelming users with data.
-
Maintain consistency
Use consistent color schemes, chart types, and naming conventions across dashboards.
-
Use clear labels
Ensure axes, legends, and filters are clearly labeled to prevent misinterpretation.
-
Optimize for performance
Limit the number of complex queries or heavy visualizations to keep dashboard load times fast.
Choosing the Right Dashboard Tool
Selecting the ideal analytics dashboard depends on factors such as privacy requirements, ease of use, budget, and integration capabilities. Evaluate tools based on your specific needs.
-
Privacy and compliance
If you need GDPR-friendly, cookie-free tracking, a tool like PlainSignal is a strong choice.
-
Feature set
Assess whether you need advanced features like predictive analytics or simple real-time reporting.
-
Cost and scalability
Compare pricing models—flat fee vs pay-as-you-go—and ensure the tool can handle your growing data volume.
-
Ease of setup
Consider how quickly you can implement and customize the dashboard without heavy developer involvement.